![]()
CHAPTER 4 - LULC DYNAMICS: THE COLONIZATION IMPACT
4.3. Land-Use/Land-Cover (LULC) dynamics
4.3.5. Property-based analysis of LULC
The property-based analysis of LULC was possible by overlaying the property grid to the LULC classifications and tabulating areas for each polygon using a GIS. Descriptive statistics and graphic outputs were then produced based on these data. The importance of this procedure relies on the fact that excluding Machadinho's communal forest reserves from the analysis allows a better comparison between the settlements regarding lot occupation and establishment. As mentioned in Chapter 2, Machadinho was implemented in 1982-1984 and Anari in 1980-1982. The two-year separation may produce a subtle difference in the final numbers but do not affect the study of LULC dynamics within the settlements. Moreover, the results show that this difference in time did not blur the picture of property lots within the settlements. Results are presented in hectares (ha) and percentages to facilitate the analysis (Tables 17 - 22). Boxplots illustrate the distribution of data for LULC classes in all periods (Figures 64 - 69).
Table 17 - LULC statistics for properties of Machadinho d’Oeste in 1988.
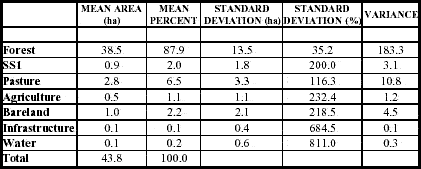
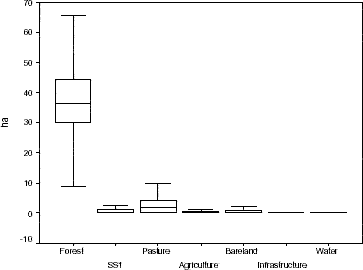
Figure 64 - LULC boxplots for properties of Machadinho d’Oeste in 1988.
Table 18 - LULC statistics for properties of Machadinho d’Oeste in 1994.
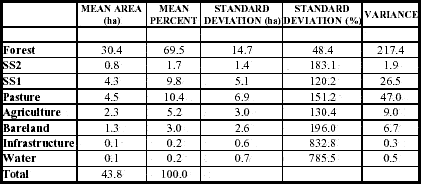
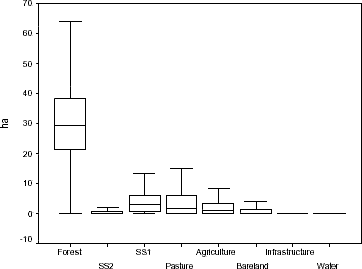
Figure 65 - LULC boxplots for properties of Machadinho d’Oeste in 1994.
Table 19 - LULC statistics for properties of Machadinho d’Oeste in 1998.
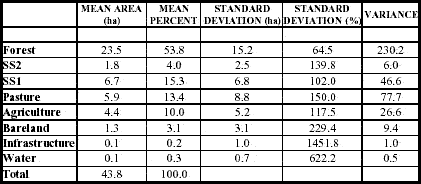
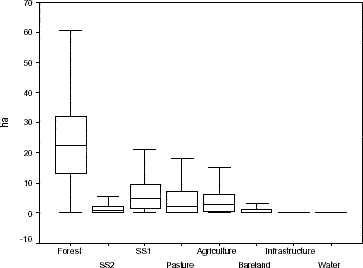
Figure 66 - LULC boxplots for properties of Machadinho d’Oeste in 1998.
Table 20 - LULC statistics for properties of Vale do Anari in 1988.
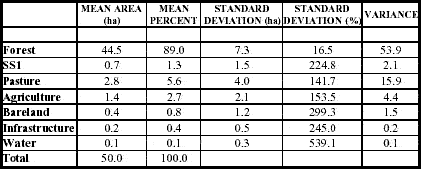
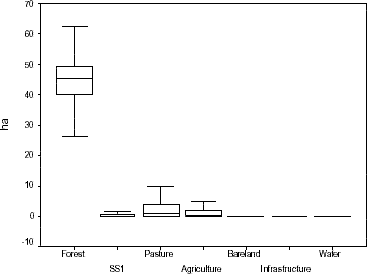
Figure 67 - LULC boxplots for properties of Vale do Anari in 1988.
Table 21 - LULC statistics for properties of Vale do Anari in 1994.
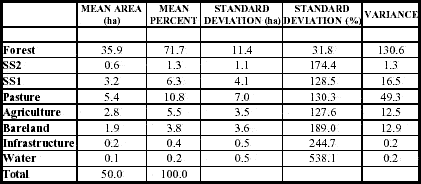
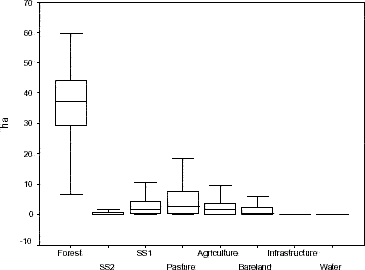
Figure 68 - LULC boxplots for properties of Vale do Anari in 1994.
Table 22 - LULC statistics for properties of Vale do Anari in 1998.

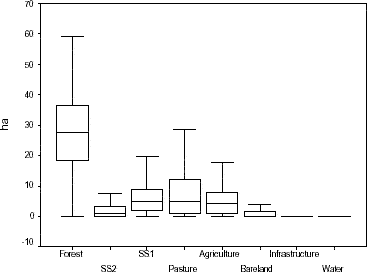
Figure 69 - LULC boxplots for properties of Vale do Anari in 1998.
The first important finding to mention is the mean property size of 43.8 ha in Machadinho (Tables 17, 18 and 19) and of 50.0 ha in Anari (Tables 20, 21 and 22). This number per se already provides a sense of property size homogeneity in Anari due to its fishbone design. Rectangular properties of 2,000 by 250 meters make the blueprint of this settlement. In Machadinho, properties vary in size and shape, being 6 ha smaller than in Anari on average, as a consequence of the settlement design being based on topography and the fact that communal forest reserves encompass 33% of the total settlement area (Figure 6).
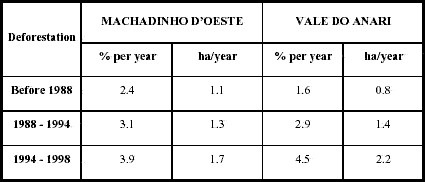
The percentage and area of forest cover within the properties add new information to the results presented in the sections above. Landowners cleared about the same percentage of their lots in Machadinho (Tables 17, 18 and 19) and in Anari (Tables 20, 21 and 22). However, the area cleared in Anari was larger than in Machadinho. At the former settlement, farmers deforested 1.4 ha/year between 1988 and 1994 and 2.2 ha/year between 1994 and 1998. In Machadinho, they cleared 1.3 ha/year and 1.7 ha/year, respectively (Table 23). In both settlements, deforestation of properties was higher between 1994 and 1998. Standard deviation and variance for forest cover are always higher in Machadinho, indicating a higher heterogeneity in land clearing and different strategies of land use among owners.
Table 23 - Rates of deforestation in Machadinho d’Oeste and Vale do Anari until 1998.
Advanced secondary succession had similar patterns in percentage of area in Machadinho and Anari. These areas are relatively small, not exceeding an average of 1 ha per property in 1994 and 2.3 ha per property in 1998 (Tables 17 to 22). Initial secondary succession showed a more dynamic picture. Machadinho has more area and percentage of area per property in SS1 than Anari in all dates. In 1998, this stage of succession covered 15.3% of the properties in Machadinho and 12.5% in Anari (Tables 19 and 22, respectively). Opposite trends occurred with pasture. They started with equal area in 1988 in both settlements (Tables 17 and 20), but in 1994 the higher pasture conversion in Anari is already clear (Tables 18 and 21). In 1998, properties had 8.1 ha (16%) of pasture in Anari (Table 22) and 5.9 ha (13.4%) in Machadinho (Table 19). Figures 65, 66, 68 and 69 illustrate the opposite trends of SS1 and pasture within the settlements.
Agricultural fields had similar land cover in both settlements in 1994 and 1998: about 5.5% of the properties in 1994 (Tables 18 and 21) and about 10% in 1998 (Tables 19 and 22). In 1988, agricultural land was three times larger in Anari (Tables 17 and 20), suggesting that the priority for pasture came with experience and time.
Bareland can be interpreted as a proxy for agriculture and pasture increment. In Machadinho, landowners prepared 1 ha of land in 1988 (Table 17) and 1.3 ha in 1994 and 1998 (Tables 18 and 19, respectively). In Anari, bareland was just 0.4 ha in 1988 against 1.9 ha in 1994 and 1.3 ha in 1998. Although it is risky to draw conclusions solely from these numbers, they indicate a higher homogeneity in farming decision-making in Machadinho through time. Next section discusses the results presented so far trying to relate trajectories of LULC in Machadinho and Anari with the spatial organization within the settlements.