![]()
CHAPTER 3 - VEGETATION STRUCTURE AS AN INDICATOR FOR LAND-COVER DYNAMICS ASSESSMENT IN THE AMAZON
3.4. Vegetation structure of secondary succession and forest in Machadinho and Anari
3.4.3. The spectral response to vegetation structure
While structural vegetation variables seem to be good indicators of secondary successional stages, the question remains about how spectral Landsat TM bands respond to their variation. Figure 33 illustrates the spectral curves for all areas where vegetation classes were sampled. SS1 and SS2 curves have a higher variability for the mean reflectance in bands 4 and 5 than SS3 and forest. These latter classes have a smaller and well-defined range for reflectance in the near infrared (band 4) and mid-infrared (band 5). The consequences of these spectral responses in terms of distinguishing different regrowth stages and forest are discussed below.
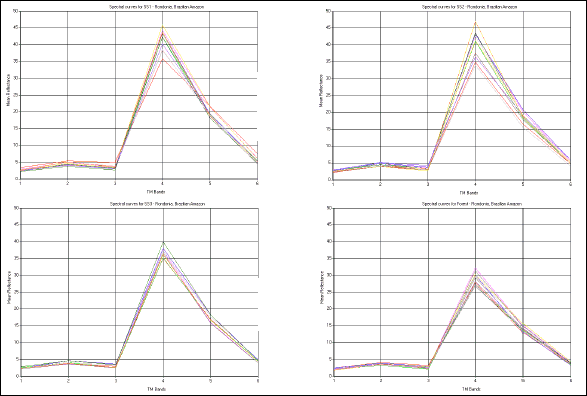
Figure 33 - Spectral curves for each group of plot samples in Machadinho d’Oeste and Vale do Anari (SS1, SS2, SS3, and forest).
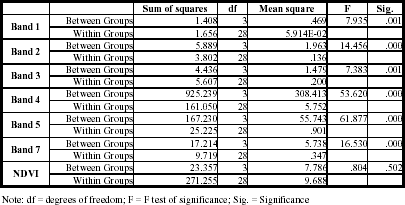
Figure 34 illustrates mean reflectance values for vegetation classes in band 3 (visible). Figure 35 shows these values for band 4 (near infrared), Figure 36 for band 5 (mid-infrared), and Figure 37 for the Normalized Difference Vegetation Index (NDVI). The significance of the vegetation classification in terms of separability by TM bands is given in Table 10. It is clear how band 5 differentiates regrowth stages better, although all TM bands have p<0.001. Band 3 shows poor distinctions in reflectance between SS1 and SS2, while SS3 overlaps with these classes of regrowth and with forest. Band 4 does not distinguish SS1 and SS2. NDVI does not separate any of the vegetation classes (p<0.502).
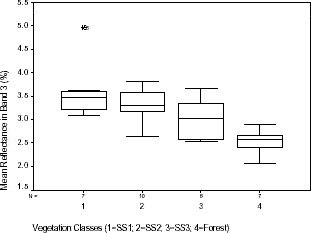
Figure 34 - Distribution of mean reflectance in Landsat TM band 3 within vegetation classes sampled in Machadinho d’Oeste and Vale do Anari.
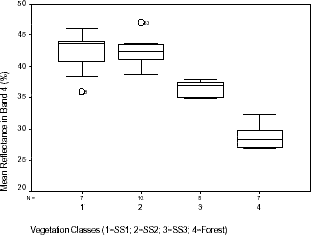
Figure 35 - Distribution of mean reflectance in Landsat TM band 4 within vegetation classes sampled in Machadinho d’Oeste and Vale do Anari.
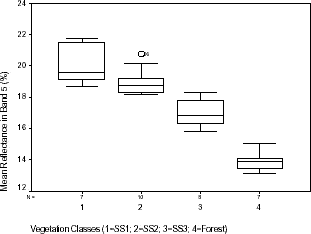
Figure 36 - Distribution of mean reflectance in Landsat TM band 5 within vegetation classes sampled in Machadinho d’Oeste and Vale do Anari.
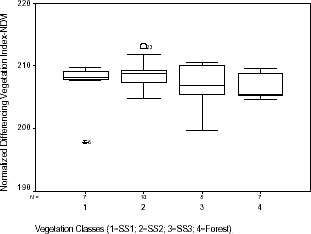
Figure 37 - Distribution of mean reflectance in Landsat TM NDVI within vegetation classes sampled in Machadinho d’Oeste and Vale do Anari.
Table 10 - Analysis of variance (ANOVA) for mean reflectance in Landsat TM bands and NDVI of sites sampled in Machadinho d’Oeste and Vale do Anari.
When using graphs to relate structural vegetation variables with reflectance values, other relationships are found. As described above, average total height of trees is a good indicator of succession stages, as it has distinct ranges for all vegetation classes defined (Figure 25). This parameter was used to build scatterplots with visible, near infrared, and mid-infrared TM bands. Band 3 (visible red) does not distinguish vegetation classes properly in terms of the average total height of trees (Figure 38). Infrared bands (4 and 5) show a better response for this structural parameter (Figures 39 and 40, respectively). However, only forest and SS3 are well separated. SS1 and SS2 overlap.
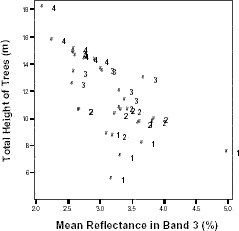
Figure 38 - Total height of trees and mean reflectance in Landsat TM band 3 within vegetation classes sampled in Machadinho d’Oeste and Vale do Anari.
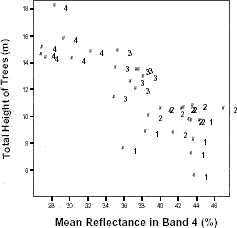
Figure 39 - Total height of trees and mean reflectance in Landsat TM band 4 within vegetation classes sampled in Machadinho d’Oeste and Vale do Anari.
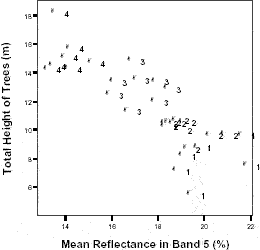
Figure 40 - Total height of trees and mean reflectance in Landsat TM band 5 within vegetation classes sampled in Machadinho d’Oeste and Vale do Anari.
Several other variables reveal similar trends in relation to spectral responses in the infrared. Figures 41, 42, 43 and 44 show these responses for DBH of trees, total basal area, density of trees, and total biomass, respectively. Tridimensional graphs of DBH and total height of trees with reflectance in bands 4 and 5 also suggest that SS1 and SS2 are not well separated spectrally by TM bands (Figures 45 and 46, respectively).
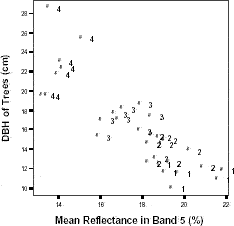
Figure 41 - DBH of trees and mean reflectance in Landsat TM band 5 within vegetation classes sampled in Machadinho d’Oeste and Vale do Anari.
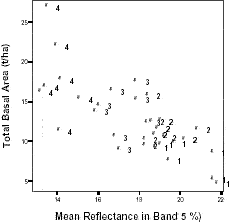
Figure 42 - Total basal area and mean reflectance in Landsat TM band 5 within vegetation classes sampled in Machadinho d’Oeste and Vale do Anari.
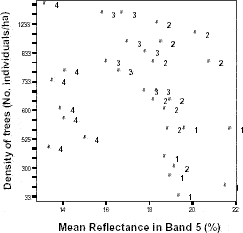
Figure 43 - Density of trees and mean reflectance in Landsat TM band 5 within vegetation classes sampled in Machadinho d’Oeste and Vale do Anari.
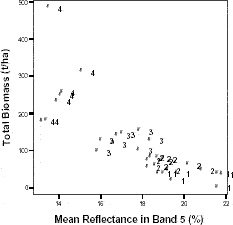
Figure 44 - Total biomass and mean reflectance in Landsat TM band 5 within vegetation classes sampled in Machadinho d’Oeste and Vale do Anari.
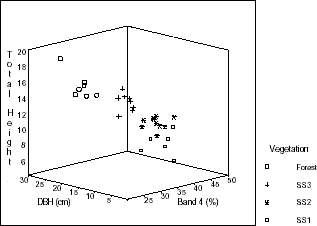
Figure 45 - Total height, DBH, and mean reflectance in Landsat TM band 4 within vegetation classes sampled in Machadinho d’Oeste and Vale do Anari.

Figure 46 - Total height, DBH, and mean reflectance in Landsat TM band 5 within vegetation classes sampled in Machadinho d’Oeste and Vale do Anari.
The integration of spectral data with the analysis of field vegetation structure supported the decision-making process when defining classes of land cover used in the next chapters.